Back to Contents Page
Viewing Statistics
Dell™ PowerConnect™ 3324/3348
User's Guide
 Viewing Tables
 Viewing RMON Information
 Viewing Charts
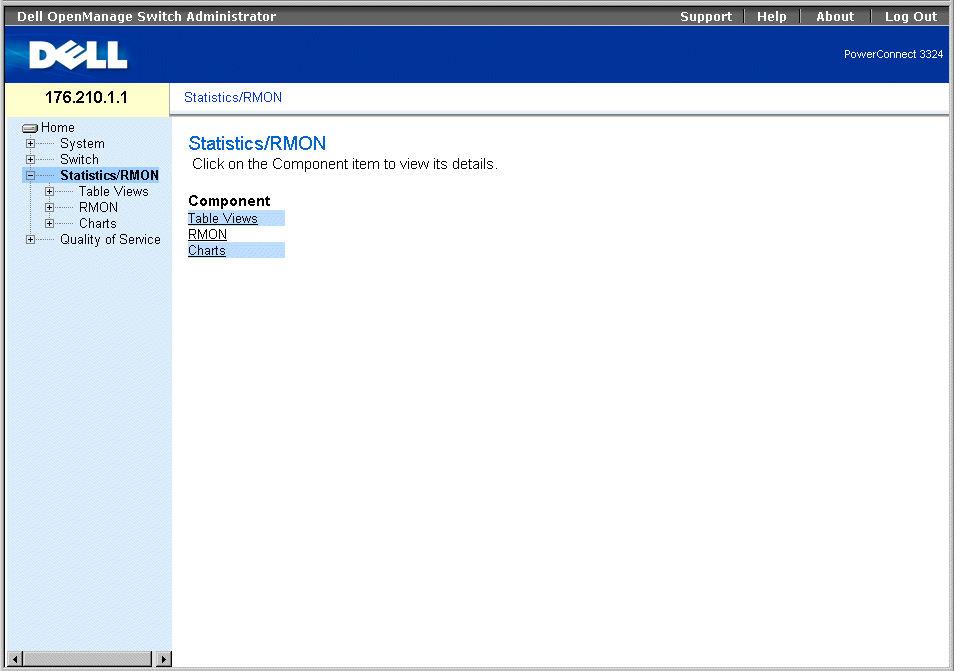
The Statistic pages contains device information for interface, GVRP, etherlike, RMON, and device utilization. To open the Statistics/RMON page:
- Click Statistics/RMON in the Tree View. The Statistics/RMON page opens.

Statistic/RMON Page
This section contains the following topics:
Viewing Tables
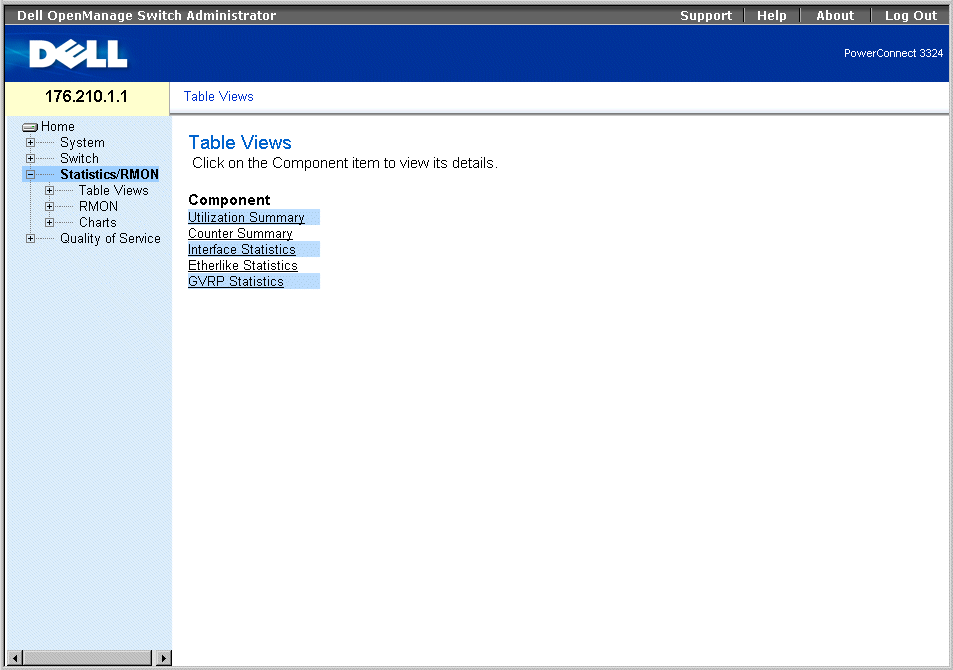
The Table View page contains links for displaying statistics in a table form. To open the Table View page:
- Click Statistics > Table in the Tree View. The Table View page opens.

Table View Page
The Table View page contains the following links:
Viewing Utilization Summary
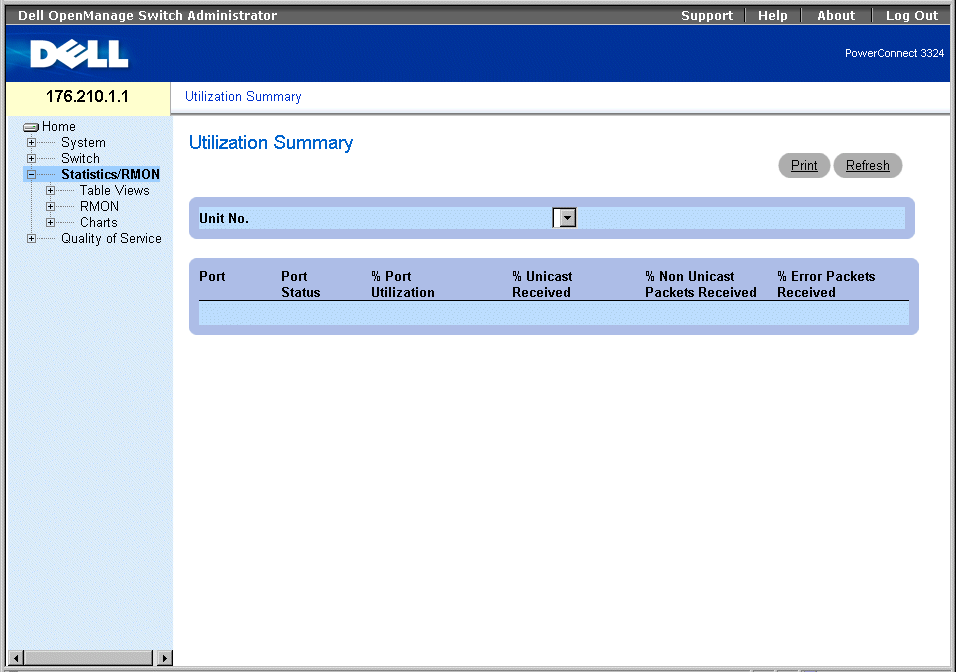
The Utilization Summary page contains statistics for port utilization. To open the Utilization Summary page:
- Click Statistics > Table View > Utilization Summary in the Tree View. The Utilization Summary page opens:

Utilization Summary Page
The Utilization Summary page contains the following fields:
- Unit No.—Indicates the unit number for which port statistics are displayed.
- Port—Indicates the port number.
- Port Status—Indicates the port status.
- % Port Utilization—Indicates the port utilization.
- % Unicast Received—Indicates the percentage of Unicast packets received on the ports.
- % Non Unicast Received—Indicates the number of bad packets received on the port
- % Error Packets Received—Indicates the number packets with errors received on the port.
Viewing utilization statistics:
- Open the Utilization Summary page.
- Select a unit in the Unit field. The utilization statistics display for the selected unit.
Viewing Counter Summary
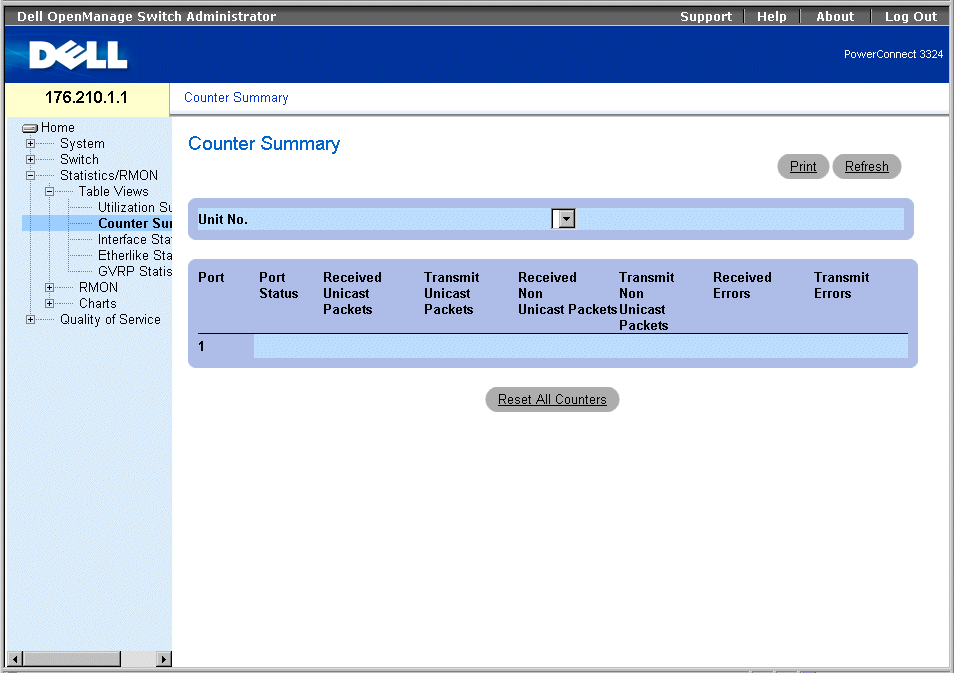
The Counter Summary page contains statistics for port utilization in numeric sums as opposed to percentages. To open the Counter Summary page:
- Click Statistics/RMON > Table Views > Counter Summary in the Tree View. The Counter Summary page opens:

Counter Summary Page
The Counter Summary page contains the following fields:
- Unit No.—Indicates the unit number for which port statistics are displayed.
- Port—Indicates the port number.
- Port Status—Indicates the port status.
- Received Unicast Packets—Indicates the number of received Unicast packets on the port.
- Transmit Unicast Packets—Indicates the number of transmitted Unicast packets from the port.
- Received Non-Unicast Packets—Indicate the number of received non-Unicast packets on the port.
- Transmit Non-Unicast Packets—Indicates the number of transmitted non-Unicast packets from the port.
- Received Errors—Indicates the number of received errors on the port.
- Transmit Errors—Indicates the number of transmitted errors from the port.
Viewing counter summary statistics:
- Open the Counter Summary page.
- Select a unit in the Unit field. The counter summary statistics display for the selected
unit.
Viewing Interface Statistics
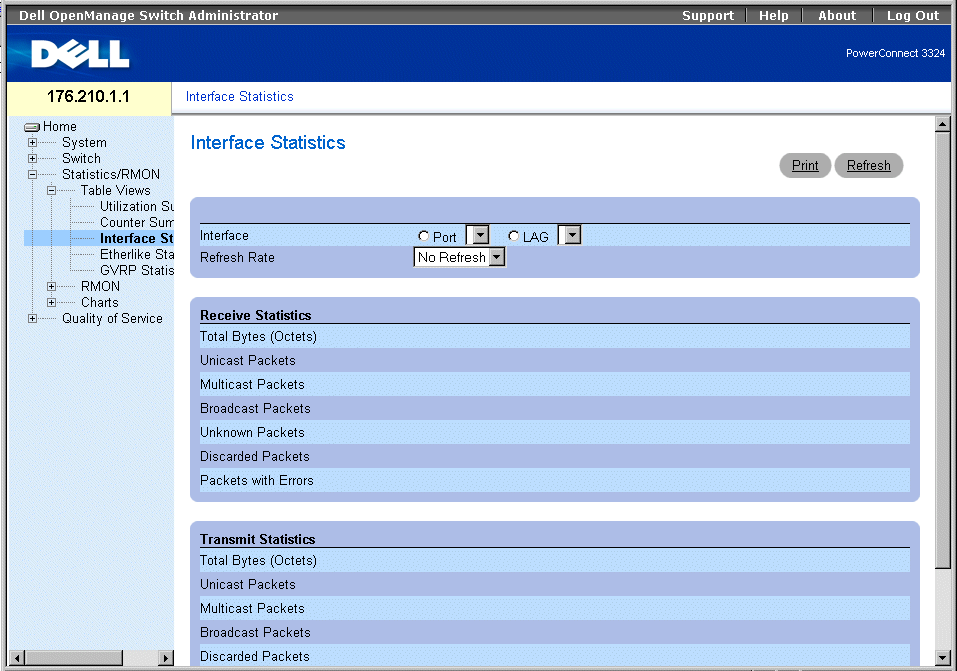
The Interface Statistics page contains interface statistics. To open the Interface Statistics page:
- Click Statistics/RMON > Table Views > Interface Statistics in the Tree View. The Interface Statistics page opens.

Interface Statistics Page
The Interface Statistics page contains the following fields:
- Interface—Specifies the interface (type and number) for which the statistics are displayed.
- Port—Indicates port statistics are displayed.
- LAG—Indicates LAG statistics are displayed.
- Refresh Rate—Indicates the amount of time that passes before the interface statistics are refreshed. The possible field values are:
- 15 Sec—Indicates that the interface statistics are refreshed every 15 seconds.
- 30 Sec—Indicates that the interface statistics are refreshed every 30 seconds.
- 60 Sec—Indicates that the interface statistics are refreshed every 60 seconds.
- No Refresh—Indicates that the interface statistics are not automatically refreshed.
- Total Bytes (Octets) Received—Displays the amount of bytes received on the selected interface.
- Received Unicast Packets—Displays the amount of Unicast packets received on the selected interface.
- Received Multicast Packets—Displays the amount of Multicast packets received on the selected interface.
- Received Broadcast Packets—Displays the amount of Broadcast packets received on the selected interface.
- Received Unknown Packets—Displays the amount of unknown packets received on the selected interface.
- Received Discarded Packets—Displays the amount of discarded packets on the selected interface during receive.
- Received Packets with Errors—Displays the amount of packets with errors received on the selected interface.
- Total Bytes (Octets) Transmitted—Displays the amount of bytes transmitted from the selected interface.
- Transmitted Unicast Packets—Displays the amount of Unicast packets transmitted from the selected interface.
- Transmitted Multicast Packets—Displays the amount of Multicast packets transmitted from the selected interface.
- Transmitted Broadcast Packets—Displays the amount of Broadcast packets transmitted from the selected interface.
- Transmitted Unknown Packets—Displays the amount of unknown packets transmitted from the selected interface.
- Transmitted Discarded Packets—Displays the amount of discarded packets from the selected interface during transmission.
- Transmitted Packets with Errors—Displays the amount of packets found to have errors during transmission from the selected interface.
Displaying interface statistics for a port:
- Open the Interface Statistics page.
- Select Port in the Interface field.
- Click Reset All Counters. The port interface statistics are displayed.
Displaying interface statistics for a LAG:
- Open the Interface Statistics page.
- Select LAG in the Interface field.
- Click Reset All Counters. The LAG interface statistics are displayed.
Viewing Interface Statistics Using the CLI Commands
This section contains the CLI commands for viewing interface statistics.
|
CLI Command
|
Description
|
|---|
show interfaces counters [ethernet interface | port-channel port-channel-number] | Displays traffic seen by a physical interface.
|
The following is an example of the CLI commands:
console# show interfaces counters ethernet 1/e1
Port InOctets InUcastPkts InMcastPkts InBcastPkts
---- ---------- ----------- ----------- -----------
1/e1 1717 0 326 26
Port OutOctets OutUcastPkts OutMcastPkts OutBcastPkts
--- ---------- ------------ ------------ ------------
1/e1 21845 0 326 26
Alignment Errors: 0
FCS Errors: 0
Single Collision Frames: 0
Multiple Collision Frames: 0
Deferred Transmissions: 0
Late Collisions: 0
Excessive Collisions: 0
Internal MAC Tx Errors: 0
Carrier Sense Errors: 0
Oversize Packets: 0
Internal MAC Rx Errors: 0
Symbol Errors: 0
Received Pause Frames: 0
Transmitted Pause Frames: 0
Viewing Etherlike Statistics
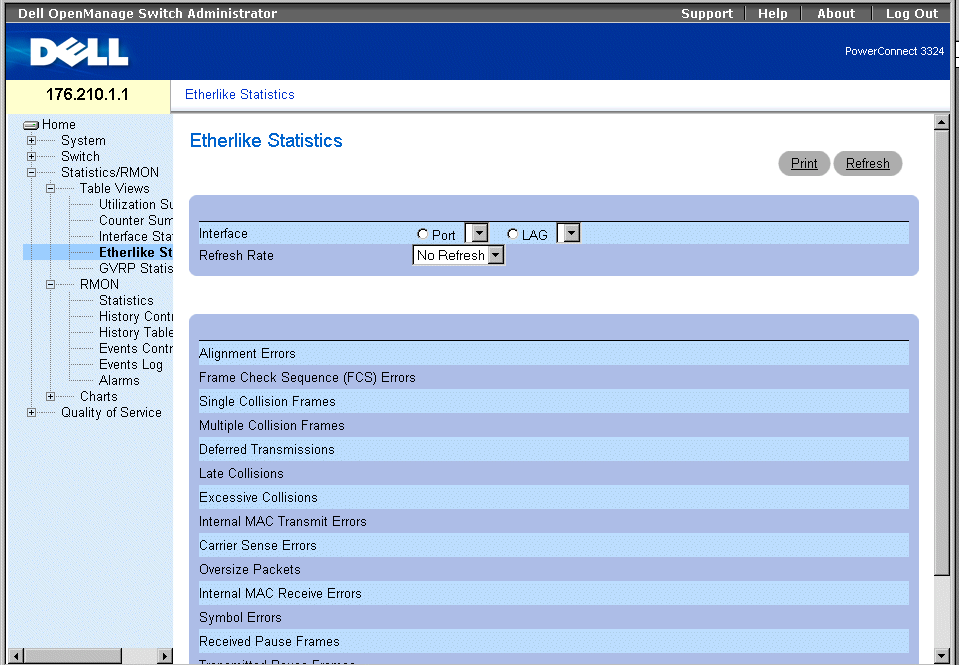
The Etherlike Statistics page contains interface statistics. To open the Etherlike Statistics page:
- Click Statistics/RMON > Table Views > Etherlike Statistics in the Tree View. The Etherlike Statistics page opens.

Etherlike Statistics Page
The Etherlike Statistics page contains the following fields:
- Interface—Specifies the interface type for which the statistics are displayed.
- Port—Indicates port statistics are displayed.
- LAG—Indicates LAG statistics are displayed.
- Refresh Rate—Indicates the amount of time that passes before the interface statistics are refreshed. The possible field values are:
- 15 Sec—Indicates that the Etherlike statistics are refreshed every 15 seconds.
- 30 Sec—Indicates that the Etherlike statistics are refreshed every 30 seconds.
- 60 Sec—Indicates that the Etherlike statistics are refreshed every 60 seconds.
- No Refresh—Indicates that the Etherlike statistics are not automatically refreshed.
- Alignment Errors—Displays the amount of alignment errors received on the selected interface.
- Frame Check Sequence (FCS) Errors—Displays the amount of Frame Check Sequence errors received on the selected interface.
- Single Collision Frames—Displays the amount of Single Collisions Frames errors received on the selected interface.
- Multiple Collision Frames—Displays the amount of Multiple Collisions Frames errors received on the selected interface.
- Deferred Transmissions—Displays the amount of deferred transmissions on the selected interface.
- Late Collision—Displays the amount of late collisions received on the selected interface.
- Excessive Collisions—Displays the amount of excessive collisions received on the selected interface.
- Internal MAC Transmit Errors—Displays the amount of Internal MAC Transmit errors on the selected interface.
- Carrier Sense Errors—Displays the amount of Carrier Sense errors on the selected interface.
- Oversize Packets—Displays the amount of frame errors that are too long on the selected interface.
- Internal MAC Receive Errors—Displays the amount of Internal MAC Received errors on the selected interface.
- Symbol Errors—Displays the amount of Symbol errors on the selected interface.
- Receive Pause Frames—Displays the amount of Received Pause frames on the selected interface (IEEE 802.3X).
- Transmitted Paused Frames—Displays the amount of Transmitted Pause frames on the selected interface (IEEE 802.3X).
Displaying Etherlike statistics for a port:
- Open the Etherlike Statistics page.
- Select Port in the Interface field.
- Click Query. The port Etherlike statistics are displayed.
Displaying Etherlike statistics for a LAG:
- Open the Etherlike Statistics page.
- Select LAG in the Interface field.
- Click Query. The LAG Etherlike statistics are displayed.
Viewing GVRP Statistics
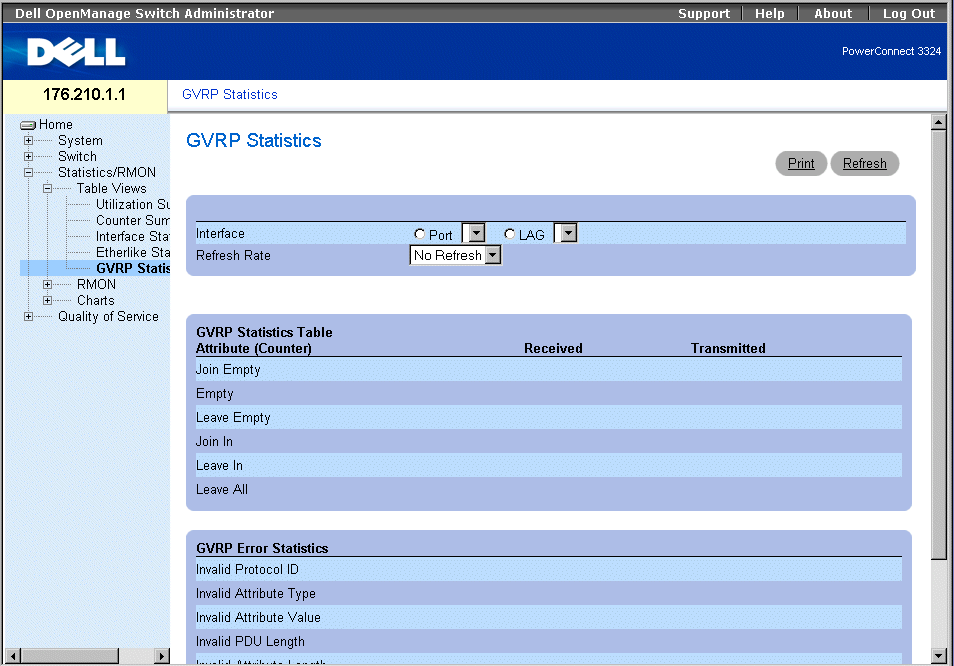
The GVRP Statistics page contains device statistics for GVRP. To open the GVRP Statistics page:
- Click Statistics/RMON > Table Views > GVRP Statistics in the Tree View. The GVRP Statistics page opens:

GVRP Statistics Page
The GVRP Statistics page contains the following fields:
- Interface—Specifies the interface type for which the statistics are displayed.
- Port—Indicates port statistics are displayed.
- LAG—Indicates LAG statistics are displayed.
- Refresh Rate—Indicates the amount of time that passes before the GVRP statistics are refreshed. The possible field values are:
- 15 Sec—Indicates that the GVRP statistics are refreshed every 15 seconds.
- 30 Sec—Indicates that the GVRP statistics are refreshed every 30 seconds.
- 60 Sec—Indicates that the GVRP statistics are refreshed every 60 seconds.
- No Refresh—Indicates that the GVRP statistics are not automatically refreshed.
- Join Empty—Displays the device GVRP Join Empty statistics.
- Empty—Displays the device GVRP Empty statistics.
- Leave Empty—Displays the device GVRP Leave statistics.
- Join In—Displays the device GVRP Join In statistics.
- Leave In—Displays the device GVRP Leave in statistics.
- Invalid Protocol ID—Displays the device GVRP Invalid Protocol ID statistics.
- Invalid Attribute Type—Displays the device GVRP Invalid Attribute ID statistics.
- Invalid Attribute Value—Displays the device GVRP Invalid Attribute Value statistics.
- Invalid PDU Length—Displays the device GVRP Invalid PDU length statistics.
- Invalid Attribute Length—Displays the device GVRP Invalid Attribute Length statistics.
- Invalid Events—Displays the device GVRP Invalid Events statistics.
Displaying GVRP statistics for a port:
- Open the GVRP Statistics page.
- Select Port in the Interface field.
- Click Query. The port GVRP statistics are displayed.
Displaying GVRP statistics for a LAG:
- Open the GVRP Statistics page.
- Select LAG in the Interface field.
- Click Query. The LAG GVRP statistics are displayed.
Viewing GVRP Statistics Using the CLI Commands
For information about viewing the GVRP instructions on a per-port basis, see the Port Statistics page. The following table describes the CLI commands.
|
CLI Command
|
Description
|
|---|
show gvrp statistics [ethernet interface | port-channel port-channel- number] | Displays GVRP statistics.
|
show gvrp error-statistics [ethernet interface| port-channel port-channel-number] | Displays GVRP error statistics.
|
The following is an example of the CLI commands:
Console# show gvrp statistics
GVRP statistics:
----------------
Legend:
rJE: Join Empty Received . : Join In Received
rEmp : Empty Received rLIn : Leave In Received
rLE : Leave Empty Received rLA : Leave All Received
sJE : Join Empty Sent sJIn : Join In Sent
sEmp : Empty Sent sLIn : Leave In Sent
sLE : Leave Empty Sent sLA : Leave All Sent
Port rJE rJIn rEmp rLIn rLE rLA sJE sJIn sEmp sLIn sLE sLA
---- --- ---- ---- ---- --- --- --- --- --- ---- 1/e1 0 0 0 0 0 0 0 0
0 0 0 0
1/e2 0 0 0 0 0 0 0 0 0 0 0 0
1/e3 0 0 0 0 0 0 0 0 0 0 0 0
1/e4 0 0 0 0 0 0 0 0 0 0 0 0
1/e5 0 0 0 0 0 0 0 0 0 0 0 0
1/e6 0 0 0 0 0 0 0 0 0 0 0 0
1/e7 0 0 0 0 0 0 0 0 0 0 0 0
1/e8 0 0 0 0 0 0 0 0 0 0 0 0
Viewing RMON Information
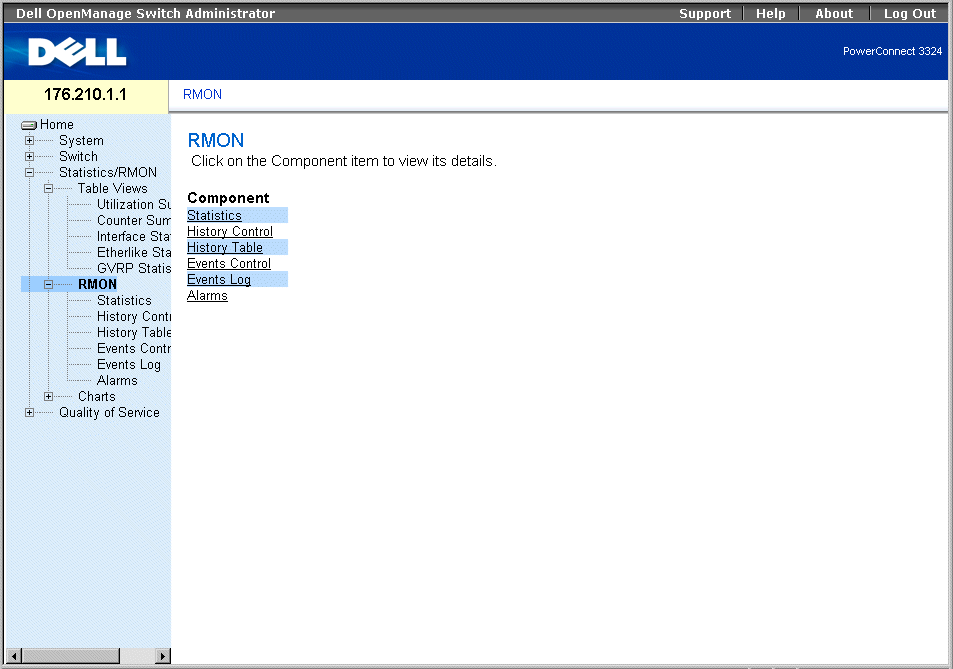
Remote Monitoring (RMON) allows network managers to view network traffic information from a remote location. To open the RMON page:
- Click Statistics/RMON > RMON in the Tree View. The RMON page opens.

RMON Page
This section contains the following topics:
Viewing RMON Statistics
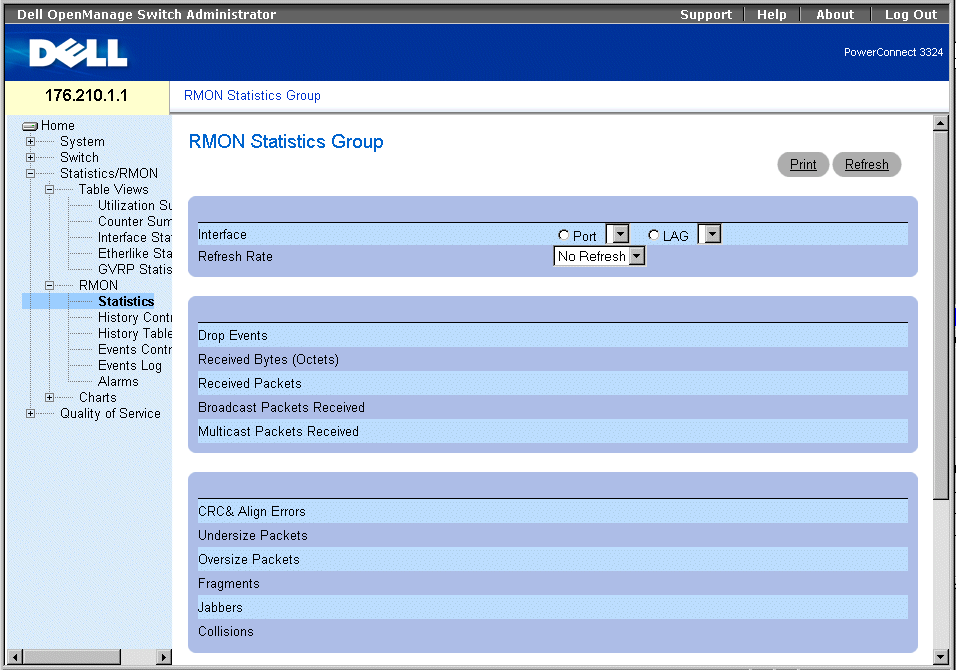
The RMON Statistics Group page allows network managers to display RMON statistics for an interface. Interface statistic provide information about device utilization, and errors that occurred on the device. To open the RMON Statistics Group page:
- Click Statistics/RMON > RMON > Statistics in the Tree View. The RMON Statistics Group page opens.

RMON Statistics Group Page
The RMON Statistics Group page contains the following information:
- Interface—Indicates the interface type and number for which statistics are displayed. The possible field values are:
- Port—Indicates that port specific statistics are displayed.
- LAG—Indicates that LAG specific statistics are displayed.
- Refresh Rate—Indicates the amount of time that passes before the RMON statistics are refreshed. The possible field values are:
- 15 Sec—Indicates that the RMON statistics are refreshed every 15 seconds.
- 30 Sec—Indicates that the RMON statistics are refreshed every 30 seconds.
- 60 Sec—Indicates that the RMON statistics are refreshed every 60 seconds.
- No Refresh—Indicates that the RMON statistics are not automatically refreshed.
- Drop Events—Indicates the amount of dropped events that have occurred on the interface since the counters were last cleared.
- Received Octets—Indicates the amount of octets received on the interface since the counters were last cleared.
- Received Packets—Indicates the amount of packets received on the interface since the counters were last cleared.
- Broadcast Packets Received—Indicates the amount of Broadcast packets received on the interface since the counters were last cleared.
- Multicast Packets Received—Indicates the amount of Multicast packets received on the interface since the counters were last cleared.
- CRC& Align Errors—Indicates the amount of CRC and Align errors that have occurred on the interface since the counters were last cleared.
- Undersize Packets—Indicates the amount of undersized packets received on the interface since the counters were last cleared.
- Oversize Packets—Indicates the amount of oversized packets received on the interface since the counters were last cleared.
- Fragments—Indicates the amount of fragments received on the interface since the counters were last cleared.
- Jabbers—Indicates the amount of jabbers received on the interface since the counters were last cleared.
- Collisions—Indicates the amount of collisions received on the interface since the counters were last cleared.
- Frames of 64 Bytes—Indicates the amount of 64 byte packets received on the interface since the counters were last cleared.
- Frames of 65-127 Bytes—Indicates the amount of 65-127 byte packets received on the interface since the counters were last cleared.
- Frames of 128-255 Bytes—Indicates the amount of 128-255 byte packets received on the interface since the counters were last cleared.
- Frames of 256-511 Bytes—Indicates the amount of 256-511 byte packets received on the interface since the counters were last cleared.
- Frames of 512-1023 Bytes—Indicates the amount of 512-1023 byte packets received on the interface since the counters were last cleared.
- Frames of 1024-1518 Bytes—Indicates the amount of 1024-1518 byte packets received on the interface since the counters were last cleared.
Viewing interface statistics:
- Open the RMON Statistics Group page.
- Select an interface type and number in the Interface field. The interface statistics
display in the RMON Statistics section.
Viewing RMON Statistics Using the CLI Commands
The following table summarizes the equivalent CLI commands for viewing fields displayed in the RMON Statistics Group page.
|
CLI Command
|
Description
|
|---|
show rmon statistics [ethernet interface | port-channel port-channel-number] | Displays RMON ethernet Statistics. |
The following is an example of the CLI command:
Console# show rmon statistics ethernet 1/e1
Port 1/e1
Dropped: 8
Octets: 878128 Packets: 978
Broadcast: 7 Multicast: 1
CRC Align Errors: 0 Collisions: 0
Undersize Pkts: 0 Oversize Pkts: 0
Fragments: 0 Jabbers: 0
64 Octets: 98 65 to 127 Octets: 0
128 to 255 Octets: 0 256 to 511 Octets: 0
512 to 1023 Octets: 491 1024 to 1518 Octets: 389
Viewing History Control Statistics
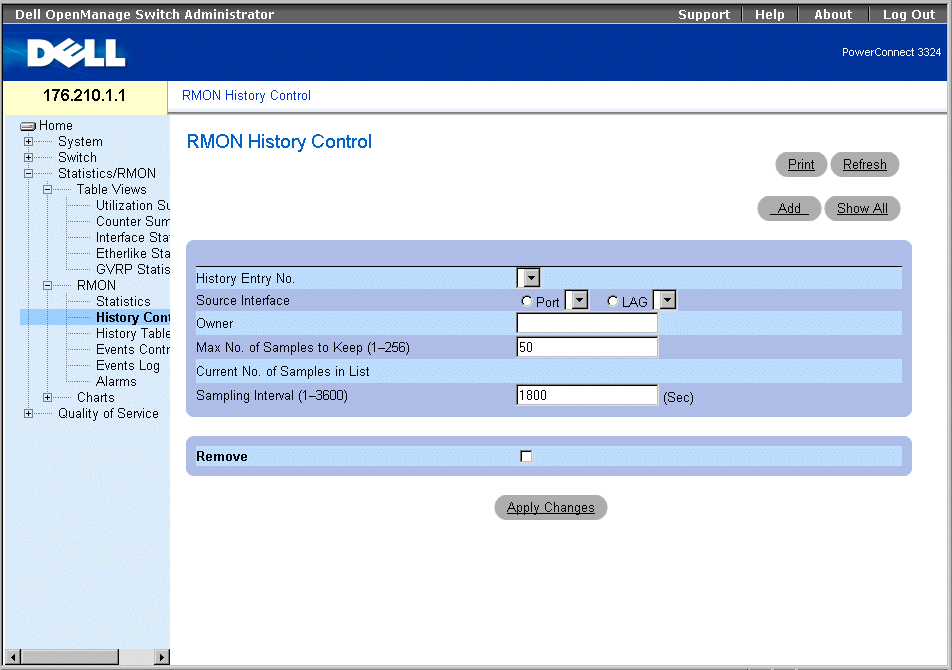
The RMON History Control page contains information about samples of RMON data taken from ports. The RMON History Control page controls the collection of these samples.
- Click Statistics/RMON > History Control in the Tree View. The RMON History Control page opens.

RMON History Control Page
The RMON History Control page contains the following information:
- History Entry No.—Specifies the History Control Table entry.
- Source Interface—Indicates the source from which the history samples were taken. The possible field values are:
- Port—Indicates the history samples were taken from a port.
- LAG—Indicates the history samples were taken from a LAG.
- Owner—Indicates the RMON station or user that requested the RMON information.
- Max Number of Samples to Keep—Indicates the number of samples to be saved. The default value is 50.
- Current Number of Samples—Indicates the current number of samples taken.
- Sampling Interval—Indicates in seconds the time that samplings are taken from the ports. The possible values are 1-3600 seconds. The default is 1800 seconds (30 minutes).
- Remove—Removes the History Control Table entry.
- Checked—Removes the History Control Table entry.
- Unchecked—Maintains the History Control Table entry.
Adding a History Control Entry:
- Open the RMON History Control page.
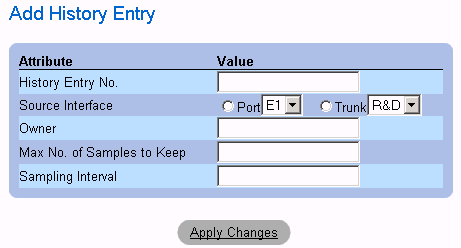
- Click Add. The Add History Entry page opens
.
Add History Entry
- Define the History Entry No., Source Interface, Owner, Max No. of Samples to Keep,
and the Sampling Interval fields.
- Click Apply Changes. The History Control Entry is added.
Modifying a History Control Table entry:
- Open the RMON History Control page.
- Select an RMON History Control Table entry in the History Index field.
- Modify the Source Interface, Owner, Max Number of Samples to Keep, Number of
Current Samples, and/or the Sampling Interval fields.
- Click Apply Changes. The RMON History Control Table entry is modified, and the
device is updated.
Displaying the History Control Table:
- Open the RMON History Control page.
- Click Show All. The History Control Table opens.

History Control Table
Deleting a History Control Table entry:
- Open the RMON History Control page.
- Select a History Control Table entry in the History Index field.
- Check the Remove check box.
- Click Apply Changes. The RMON History Control Table entry is deleted, and the
device is updated.
Viewing The RMON History Table
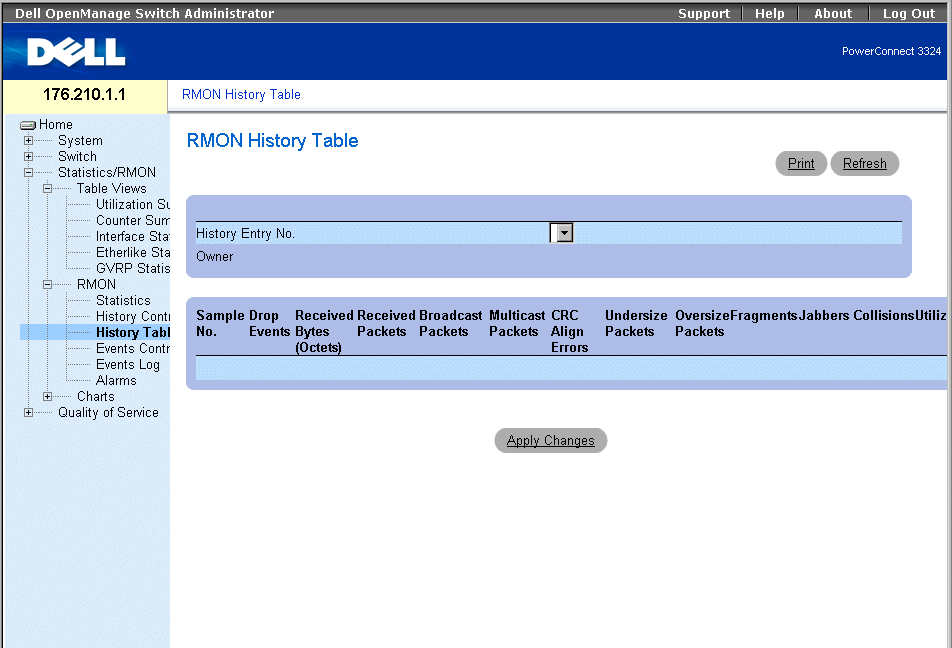
The RMON History Table contains interface-specific RMON statistical network samplings. Each table entry represents all counter values compiled during a single sample. To open the RMON History Table:
- Click Statistics/RMON > RMON History > History Table in the Tree View.

RMON History Table
 |
NOTE: Not all fields are shown in the RMON History Table.
|
The RMON History Table contains the following fields:
- Sample No.—Indicates the specific sample that the information in the table reflects.
- Drop Events—Indicates the number of dropped packets due to lack of network resources during the sampling interval. This may not represent the exact number of dropped packets, but rather the number of times dropped packets were detected.
- Received Bytes (Octets)—Indicates the number of data octets, including bad packets, received on the network.
- Received Packets—Indicates the number of packets received during the sampling interval.
- Broadcast Packets—Indicates the number of good broadcast packets received during the sampling interval.
- Multicast Packets—Indicates the number of good multicast packets received during the sampling interval.
- CRC Align Errors—Indicates the number of packets received during the sampling session with a length 64-1518 octets.that have a bad Frame Check Sequence (FCS) with an integral number of octets or a bad FCS with a non-integral number.
- Undersized Packets—Indicates the number of packets received that are less than 64 octets long during the sampling session.
- Oversized Packets—Indicates the number of packets received that are more than 1518 octets long during the sampling session.
- Fragments—Indicates the number of packets received that are less than 64 octets long and have a FCS during the sampling session.
- Jabbers—Indicates the number of packets received that are more than 1518 octets long and had a FCS during the sampling session.
- Collisions—Estimates the total number of packet collisions that occurred during the sampling session. Collisions are detected when repeater ports detect two or more stations transmitting simultaneously.
- Utilization—Estimates the main physical layer network Description on an interface during the session sampling. The value is reflected in percentages with two decimal places.
Viewing statistics for a specific history entry:
- Open the RMON History Table page.
- Select a history entry in the History Table No. field. The entry statistics display in the
RMON History Table.
Viewing RMON History Statistics Using the CLI Commands
The following table contains the CLI commands for viewing RMON history statistics.
|
CLI Command
|
Description
|
|---|
rmon table-size history entries | Configures the maximum number of history table entries. |
rmon collection history index [owner ownername] [buckets bucket-number] [interval seconds] | Enables a Remote Monitoring (RMON) MIB history statistics group on an interface. |
show rmon history index {throughput | errors | other} [period hh:mm:ss] | Displays RMON ethernet Statistics history. |
The following is an example of the CLI commands:
Console (config)# rmon table-size history 1000
Console (config)# interface ethernet 1/e8
Console (config-if)# rmon collection history 1 interval 2400
Console# show rmon history 1 throughput
Sample set: 1 Owner: CLI
Interface: 1/e1 Interval: 1800
Requested samples: 50 Granted samples: 50
Maximum table size: 500
Day: Jan 18 2002
Time Octets Packets Broadcast Multicast Utilization
-------- ------- ------- --------- --------- ----------
23:58:30 878128 878 7 1 20.87%
23:59:00 75898768 91892 932 1723 19.27%
23:59:30 171797536 193784 1817 3289 19.82%
Day: Jan 19 2002
Time Octets Packets Broadcast Multicast Utilization
---- ------ ------- --------- --------- -----------
00:00:00 287696304 275686 2789 5878 20.17%
00:00:30 303595962 357568 3289 7287 19.98%
Defining Device Events
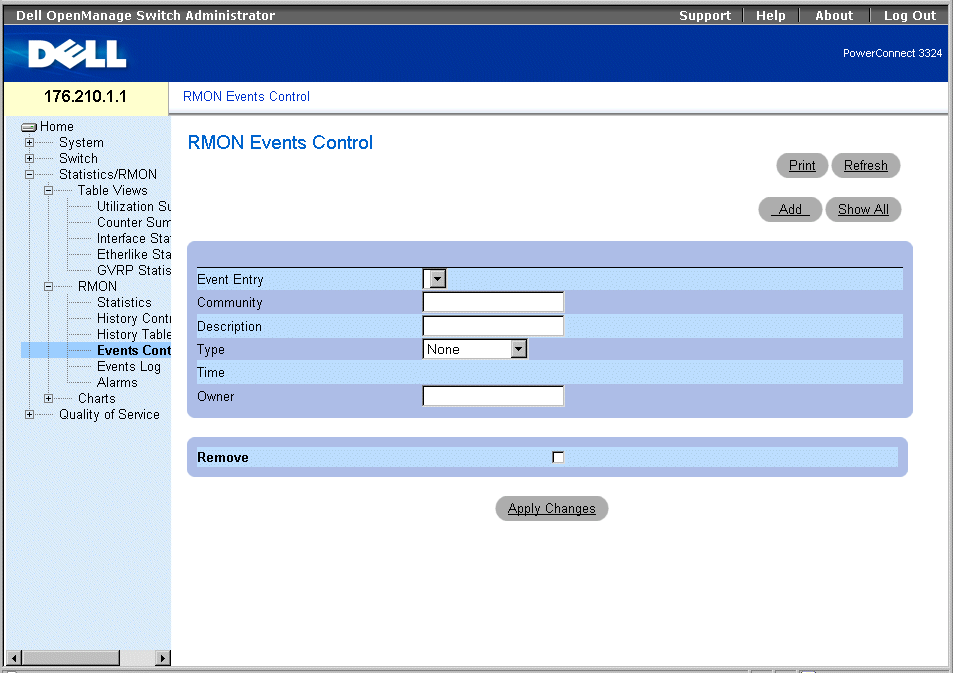
The RMON Events Control page allows network managers to view RMON events. The RMON Events table can be opened from the RMON Events Control table. To open the RMON Events Control page:
- Click Statistics/RMON > RMON > Events in the Tree View. The RMON Events Control page opens.

RMON Events Control Page
The RMON Events Control page contains the following fields:
- Event Entry—Indicates the event.
- Community—Specifies the SNMP community to which the event belongs.
- Description—Provides a user-defined event description.
- Type—Describes the event type. The possible field values are:
- Log—Indicates the event type is a log entry.
- Trap—Indicates the event type is a trap.
- Log and Trap—Indicates the event type is both a log entry and a trap.
- Time— Indicates the time at which the event occurred.
- Owner—Indicates the device or user that defined the event.
- Remove—Removes the event from the Events Table.
- Checked—Removes the event from the Events Table.
- Unchecked—Maintains the event from the Events Table.
Adding a RMON Event:
- Open the RMON Events Control page.
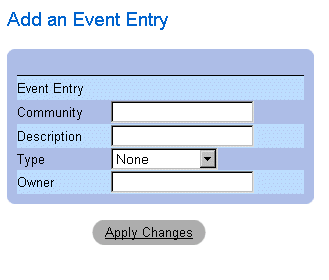
- Click Add. The Add New RMON Event page opens.

Add New RMON Event
- Define the New Event Index, Community, Description, Type, and Owner fields.
- Click Apply Changes. The Event Table entry is added, and the device is updated.
Modifying a RMON Event:
- Open the RMON Events Control page.
- Select an Event Table entry in the Event Entry field.
- Modify the Community, Description, Type, and/or Owner fields.
- Click Apply Changes. The Event Table entry is modified, and the device is updated.
Displaying the RMON Event Table:
- Open the RMON Events Control page.
- Click Show All. The Event Table opens.

RMON Events Table
Deleting multiple RMON Event entries:
- Open the RMON Events Control page.
- Select an Event Table entry in the Event Index field.
- Check the Remove check box.
- Click Apply Changes. The Event Table entry is deleted, and the device is updated.
 |
NOTE: A single Event entry can be removed from the RMON Events page using the Remove
check box.
|
Defining and Displaying RMON Events Control Using the CLI Commands
The following table summarizes the equivalent CLI commands for configuring and displaying fields in the RMON Events Control page.
|
CLI Command
|
Description
|
|---|
rmon event index type [community text] [description text] [owner name] | Configures a RMON event. |
show rmon events | Displays the RMON event table. |
The following is an example of the CLI commands:
Console (config)# rmon event 10 log
Config (config)# exit
Console# show rmon events
Index Description Type Community Owner Last time sent
---- ----------- ------ ------ ----- -------------------
1 Errors Log CLI Jan 18 2002 23:58:17
2 High Broadcast Log-Trap device Manager Jan 18 2002 23:59:48
Viewing the Events Log
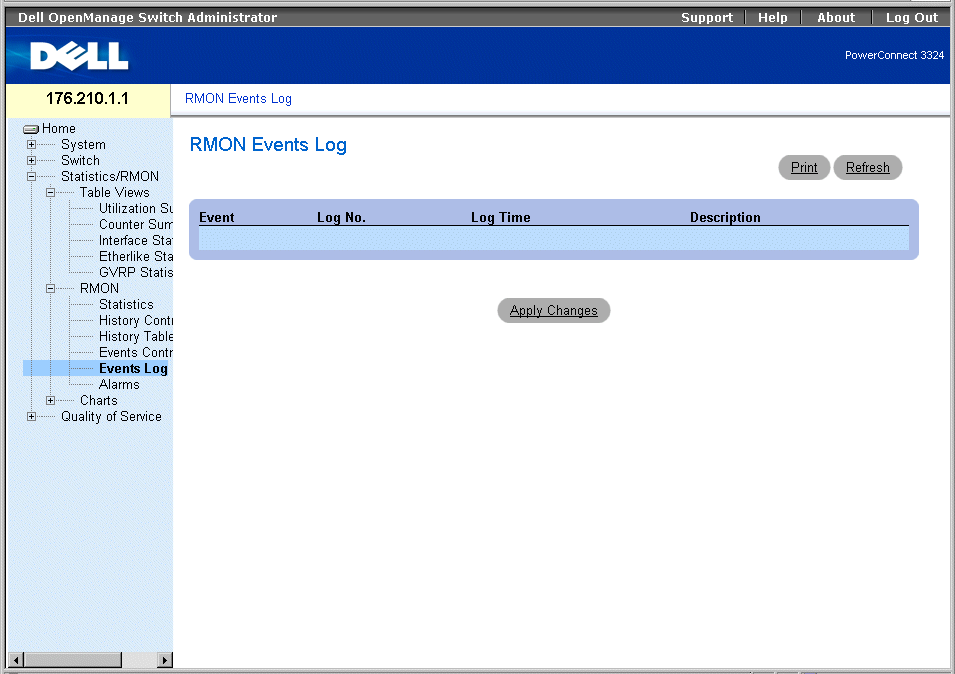
The RMON Events Log page contains a list the RMON Events. To open the RMON Events Log:
- Click Statistics/RMON > RMON> Events in the Tree View. The RMON Events Log page opens.

RMON Events Log Page
The RMON Events Log page contains the following fields:
- Event—Identifies the RMON Event Log entry number.
- Log No.— Indicates the log number.
- Log Time—Specifies the time at which the log entry was entered.
- Description—Describes the log entry.
Viewing RMON Events Log Using the CLI Commands
The following table summarizes the equivalent CLI commands for viewing fields displayed in the RMON Events Log page.
|
CLI Command
|
Description
|
|---|
rmon table-size log entries | Configures maximum number of log table entries. |
show rmon log [event] | Displays the RMON logging table. |
The following is an example of the CLI commands:
Console (config)# rmon table-size log 500
Console# show rmon log
Maximum table size: 500
Event Description Time
----- ----------- --------------------
1 Errors Jan 18 2002 23:48:19
1 Errors Jan 18 2002 23:58:17
2 High Broadcast Jan 18 2002 23:59:48
Console# show rmon log
Maximum table size: 500 (800 after reset)
Event Description Time
----- ----------- --------------------
1 Errors Jan 18 2002 23:48:19
1 Errors Jan 18 2002 23:58:17
2 High Broadcast Jan 18 2002 23:59:48
Defining Device Alarms
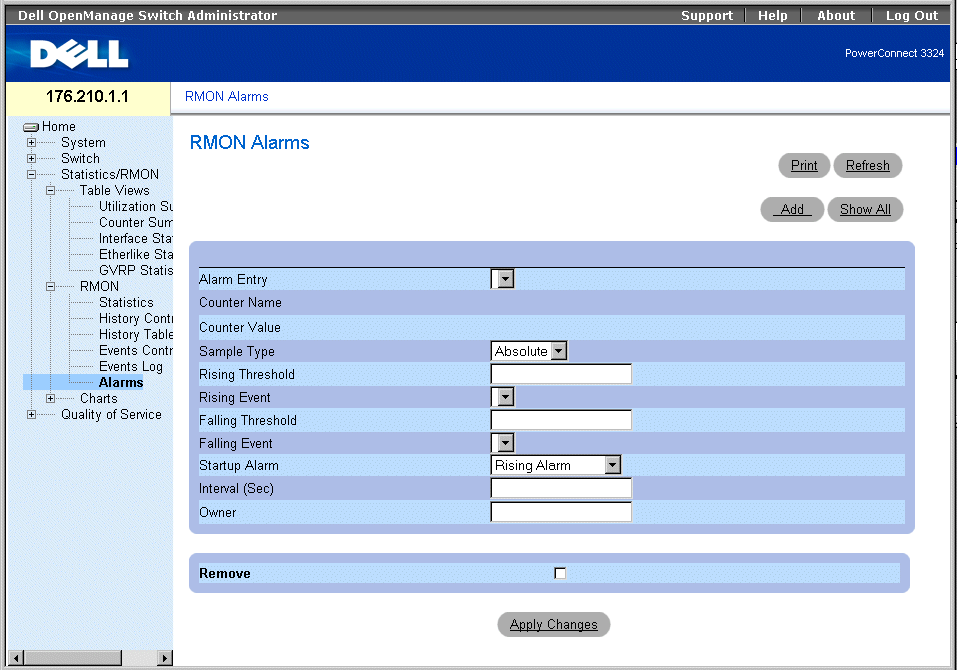
The RMON Alarm page allows network administrators to set network alarms. Network alarms occur when a network problem is detected. Rising and falling thresholds generate alarms. To open the RMON Alarm page:
- Click Statistics/RMON > RMON> Alarms in the Tree View. The RMON Alarm page opens.

RMON Alarm Page
The RMON Alarm page contains the following fields:
- Alarm Entry—Indicates a specific alarm.
- Counter Name—Indicates the selected RMON counter.
- Counter Value—Indicates the value of the RMON counter.
- Sample Type—Specifies the sampling method for the selected variable and compares the value against the thresholds. The possible field values are:
- Delta—Subtracts the last sampled value from the current value. The difference in the values is compared to the threshold.
- Absolute—Compares the values directly with the thresholds at the end of the sampling interval.
- Rising Threshold—The rising counter value that triggers the rising threshold alarm.
- Rising/Falling Event—The mechanism that reports the alarms: LOGed or TRAPed or a combination of both. When LOG is selected, there is no saving mechanism either in the device or in the management system. However, if the device is not being reset, it remains in the device LOG table. If TRAP is selected, a TRAP via SNMP is generated and reported via the TRAP's general mechanism. The TRAP can be saved using the same mechanism.
- Falling Threshold—The falling counter value that triggers the falling threshold alarm.
 |
NOTE: The Rising and Falling thresholds are graphically presented on top of the graph bars.
Each monitored variable has a designated color.
|
- Startup Alarm—The trigger that activates the alarm. Rising is defined by crossing the threshold from a low value threshold to a higher value threshold. The possible field values are:
- Rising Alarm
- Falling Alarm
- Rising and Falling Alarm
- Interval—Indicates the alarm interval time.
- Owner—Indicates the device or user that defined the alarm.
- Remove—Removes an RMON Alarm.
- Check—Removes an Alarm Table entry.
- Unchecked—Maintains an Alarm Table entry.
Adding an Alarm Table entry:
- Open the RMON Alarm page.
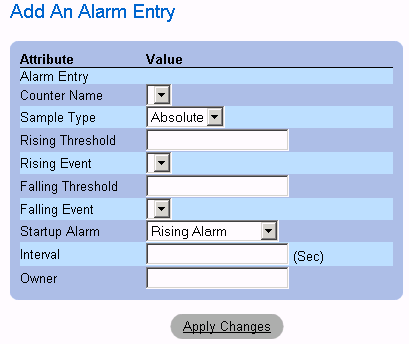
- Click Add. The New Alarm Entry page opens.

New Alarm Entry
- Define the New Alarm Index, Sample Variable, Sample Type, Rising Threshold,
Rising Event, Falling Threshold, Falling Event, Startup Alarm, Interval, and Owner
fields.
- Click Apply Changes. The RMON alarm is added, and the device is updated.
Modifying an Alarm Table entry:
- Open the RMON Alarm page.
- Select an RMON Alarm Table entry in the Alarm Entry drop-down box.
- Modify the Sample Type, Rising Threshold, Rising Event, Falling Threshold, Falling
Event, Startup Alarm, Interval, and/or Owner fields.
- Click Apply Changes. The RMON Alarm Table entry is modified, and the device is
updated.
Displaying the Alarm Table:
- Open the RMON Alarm Table.
- Click Show All. The RMON Alarm Table opens.

RMON Alarm Table
Deleting an Alarm Table entry:
- Open the RMON Alarm page.
- Select an RMON Alarm in the Alarm Entry drop-down box.
- Check the Remove check box.
- Click Apply Changes. The RMON Alarm Table entry is deleted, and the device is
updated.
Defining and Displaying Device Alarms Using the CLI Commands
The following table summarizes the equivalent CLI commands for configuring and displaying fields in the RMON Alarm page.
|
CLI Command
|
Description
|
|---|
rmon alarm index variable interval rthreshold fthreshold revent fevent [type type] [startup direction] [owner name] | Configures alarm conditions. |
show rmon alarm-table | Displays the alarm summary table. |
show rmon alarm number | Displays alarm configurations. |
The following is an example of the CLI command:
Console (config)# rmon alarm 1.3.6.1.2.1.2.2.1.10 1000000 10 20
Console (config)# exit
Console# show rmon alarm-table
Index OID Owner
----- ----------------------- -------
1 1.3.6.1.2.1.2.2.1.10.1 CLI
2 1.3.6.1.2.1.2.2.1.10.1 Manager
3 1.3.6.1.2.1.2.2.1.10.9 CLI
Console# show rmon alarm 1
Alarm 1
-------
OID: 1.3.6.1.2.1.2.2.1.10.1
Last sample Value: 878128
Interval: 30
Sample Type: delta
Startup Alarm: rising
Rising Threshold: 8700000
Falling Threshold: 78
Rising Event: 1
Falling Event: 1
Owner: CLI
Viewing Charts
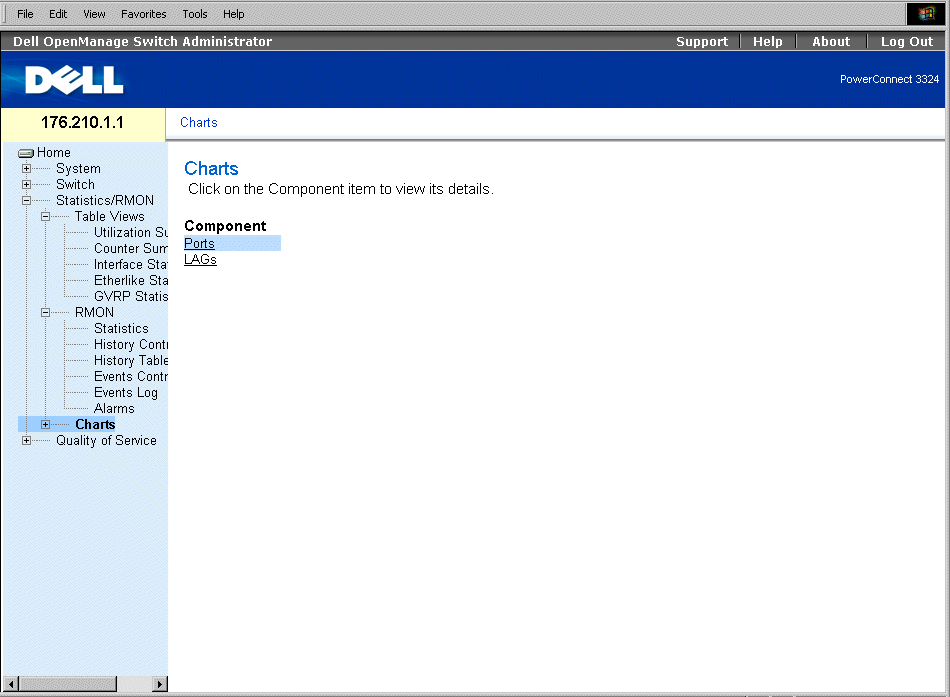
The Charts page contains links for displaying statistics in a chart form. To open the Charts page:
- Click Statistics > Charts in the Tree View. The Charts page opens.

Charts Page
The Charts page contains the following links:
Viewing Port Statistics
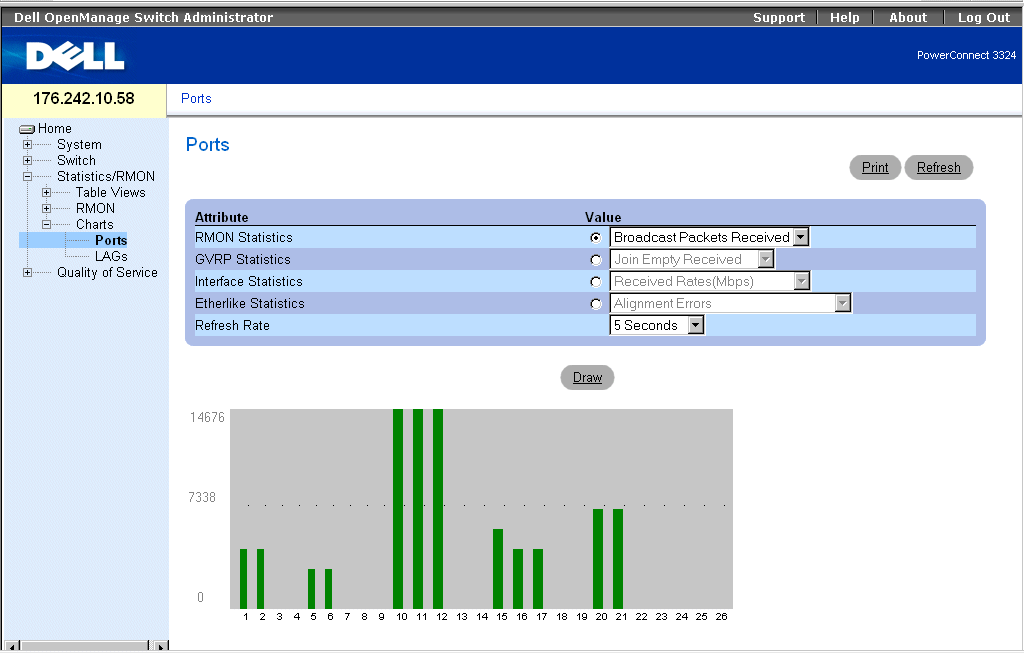
The Ports page displays statistics in a chart form for a selected port. To open the Port Statistics page:
- Click Statistics > Charts > Ports in the Tree View. The Port Statistics page opens.

Port Statistics Page
The Port Statistics page contains the following fields:
- Interface Statistics—Provides interface statistics for the selected unit.
- Etherlike Statistics—Provides Etherlike statistics for the selected unit.
- RMON Statistics—Provides RMON statistics for the selected unit.
- GVRP Statistics—Provides GVRP statistics for the selected unit.
- Refresh Rate—Specifies the amount of time that passes before the device is refreshed. The possible field values are:
- 15 Sec—Indicates that the port statistics are refreshed every 15 seconds.
- 30 Sec—Indicates that the port statistics are refreshed every 30 seconds.
- 60 Sec—Indicates that the port statistics are refreshed every 60 seconds.
- No Refresh—Indicates that the port statistics are not automatically refreshed.
Displaying Port Specific Statistics
- Open the Port Statistics page.
- Select the statistics category and port.
- Click Draw. The statistics for the selected interface is displayed.
Viewing Port Statistics Using the CLI Commands
The following table summarizes the equivalent CLI commands for viewing fields displayed on the Port Statistics page.
|
CLI Command
|
Description
|
|---|
clear counters [ethernet interface | port-channel port-channel-number] | Clears statistics on an interface. |
show rmon statistics [ethernet interface | port-channel port-channel-number] | Displays RMON ethernet Statistics. |
clear gvrp statistics [ethernet interface | port-channel port-channel-number] | Clears all the GVRP statistics information. |
show gvrp statistics [ethernet interface | port-channel port-channel-number] | Displays GVRP statistics. |
show gvrp error-statistics [ethernet interface | port-channel port-channel-number] | Displays GVRP error statistics. |
The following is an example of the CLI commands:
Console# clear counters ethernet 1/e1
Console# show rmon statistics ethernet 1/e1
Port 1/e1
Dropped: 8
Octets: 878128 Packets: 978
Broadcast: 7 Multicast: 1
CRC Align Errors: 0 Collisions: 0
Undersize Pkts: 0 Oversize Pkts: 0
Fragments: 0 Jabbers: 0
64 Octets: 98 65 to 127 Octets: 0
128 to 255 Octets: 0 256 to 511 Octets: 0
512 to 1023 Octets: 491 1024 to 1518 Octets: 389
Console # configure
Console (config)# clear gvrp statistics ethernet 1/e8
Console (config)# exit
Console# show gvrp statistics
GVRP statistics:
----------------
Legend:
rJE : Join Empty Received rJIn : Join In Received
rEmp : Empty Received rLIn : Leave In Received
rLE : Leave Empty Received rLA : Leave All Received
sJE : Join Empty Sent sJIn : Join In Sent
sEmp : Empty Sent sLIn : Leave In Sent
sLE : Leave Empty Sent sLA : Leave All Sent
Port rJE rJIn rEmp rLIn rLE rLA sJE sJIn sEmp sLIn sLE sLA
---- --- ---- ---- ---- --- --- --- --- --- ---- --- ---
1/e1 0 0 0 0 0 0 0 0 0 0 0 0
1/e2 0 0 0 0 0 0 0 0 0 0 0 0
1/e3 0 0 0 0 0 0 0 0 0 0 0 0
1/e4 0 0 0 0 0 0 0 0 0 0 0 0
1/e5 0 0 0 0 0 0 0 0 0 0 0 0
1/e6 0 0 0 0 0 0 0 0 0 0 0 0
1/e7 0 0 0 0 0 0 0 0 0 0 0 0
1/e8 0 0 0 0 0 0 0 0 0 0 0 0
Console# show gvrp error-statistics
GVRP error statistics:
----------------
Legend:
INVPROT : Invalid Protocol Id INVPLEN : Invalid PDU Length
INVATYP : Invalid Attribute Type INVALEN : Invalid Attribute
Length
INVAVAL : Invalid Attribute Value INVEVENT : Invalid Event
Port INVPROT INVATYP INVAVAL INVPLEN INVALEN INVEVENT
---- ------- ------- ------- ------ ------- --------
1/e1 0 0 0 0 0 0
1/e2 0 0 0 0 0 0
1/e3 0 0 0 0 0 0
1/e4 0 0 0 0 0 0
1/e5 0 0 0 0 0 0
1/e6 0 0 0 0 0 0
1/e7 0 0 0 0 0 0
1/e8 0 0 0 0 0 0
Viewing LAG Statistics
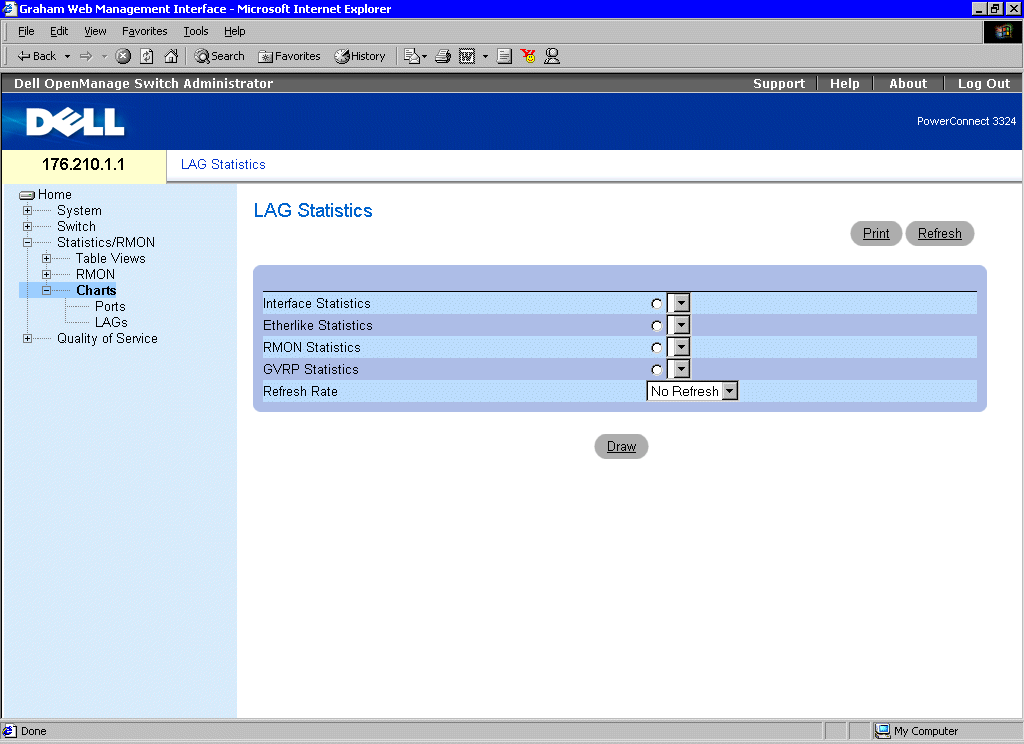
The LAG Statistics page displays statistics in a chart form for port elements. To open the LAG Statistics page:
- Click Statistics > Charts > LAGs in the Tree View. The LAG Statistics page opens.

LAG Statistics Page
The LAG Statistics page contains the following fields:
- Interface Statistics—Provides interface statistics for trunks.
- Etherlike Statistics—Provides Etherlike statistics for trunks.
- RMON Statistics—Provides RMON statistics for trunks.
- GVRP Statistics—Provides GVRP statistics for trunks.
- Refresh Rate—Specifies the amount of time that passes before the device is refreshed. The possible field values are:
- 15 Sec—Indicates that the LAG statistics are refreshed every 15 seconds.
- 30 Sec—Indicates that the LAG statistics are refreshed every 30 seconds.
- 60 Sec—Indicates that the LAG statistics are refreshed every 60 seconds.
- No Refresh—Indicates that the LAG statistics are not refreshed.
Displaying Port Specific Statistics:
- Open the Port Statistics page.
- Select an interface type.
- Click Draw. The statistics for the selected interface is displayed.
Viewing LAG Statistics Using the CLI Commands
The following table contains the CLI commands for viewing LAG statistics.
|
CLI Command
|
Description
|
|---|
show interfaces counters [ ethernet interface | port-channel port-channel-number] | Displays statistics for a physical interface.
|
The following is an example of the CLI commands:
Console# show interfaces counters
Port InOctets InUcastPkts InMcastPkts InBcastPkts
---- ---------- --------- --------- ------------
1/e1 183892 1289 987 8
2/e1 0 0 0 0
3/e1 123899 1788 373 19
Port OutOctets OutUcastPkts OutMcastPkts OutBcastPkts
---- ---------- --------- --------- ------------
1/e1 9188 9 8 0
2/e1 0 0 0 0
3/e1 8789 27 8 0
Ch InOctets InUcastPkts InMcastPkts InBcastPkts
---- ---------- --------- -------- ------------
1 27889 928 0 78
Ch OutOctets OutUcastPkts OutMcastPkts OutBcastPkts
---- ---------- --------- --------- ------------
1 23739 882 0 122
Console# show interfaces counters ethernet 1/e1
Port InOctets InUcastPkts InMcastPkts InBcastPkts
---- ---------- --------- --------- ------------
1/e1 183892 1289 987 8
Port OutOctets OutUcastPkts OutMcastPkts OutBcastPkts
---- ---------- --------- --------- ------------
1/e1 9188 9 8 0
Alignment Errors: 17
FCS Errors: 8
Single Collision Frames: 0
Multiple Collision Frames: 0
SQE Test Errors: 0
Deferred Transmissions: 0
Late Collisions: 0
Excessive Collisions: 0
Internal MAC Tx Errors: 0
Carrier Sense Errors: 0
Oversize Packets: 0
Internal MAC Rx Errors: 0
Symbol Errors: 0
Received Pause Frames: 0
Transmitted Pause Frames: 0
----------------------------------------------------------------------------------------
Back to Contents Page
 Viewing Tables